
Liquid Glass DesignDesign8 min read
Glassy dashboard design: 9 examples and chart rules
Nine glassy dashboard designs from our gallery, plus rules for charts on glass: contrast, direct labels, big numbers and which panels stay opaque.
On this page
- Nine glass dashboard UI examples
- Payrix web dashboard by RonDesignLab
- Payrix account card by Jack R.
- Payrix mobile by Jack R.
- QuickBooks dashboard by Hadi Altaf
- Glassmorphism Dashboard by Leon Abramovic
- Provit by Dipa Product
- Energy Analytics by Dtail Studio
- Construction widgets by Rakibul
- Credit tiles by RonDesignLab
- Rules for charts and numbers on glass
- Where to keep surfaces opaque
- Sources
In a glassy dashboard, glass helps when it frames the data: the sidebar, the top bar, a filter row, one summary card in the hero. It hurts when charts, tables and small numbers sit directly on a translucent surface, because their contrast then depends on whatever is behind the glass. The dashboards in our gallery that read well almost all follow the same split, glass for the frame and near-opaque panels for the data.
Apple says much the same about its own material. In the WWDC25 session "Meet Liquid Glass", the guidance is that "Liquid Glass is best reserved for the navigation layer. Avoid putting glass in the content layer." A dashboard is almost entirely content layer, which is why the rules below lean conservative.
Below are nine dashboards from our gallery with notes on what each designer did, then practical rules for charts on glass. Each title links to the gallery page with full credit and a style prompt.
Nine glass dashboard UI examples
Payrix web dashboard by RonDesignLab
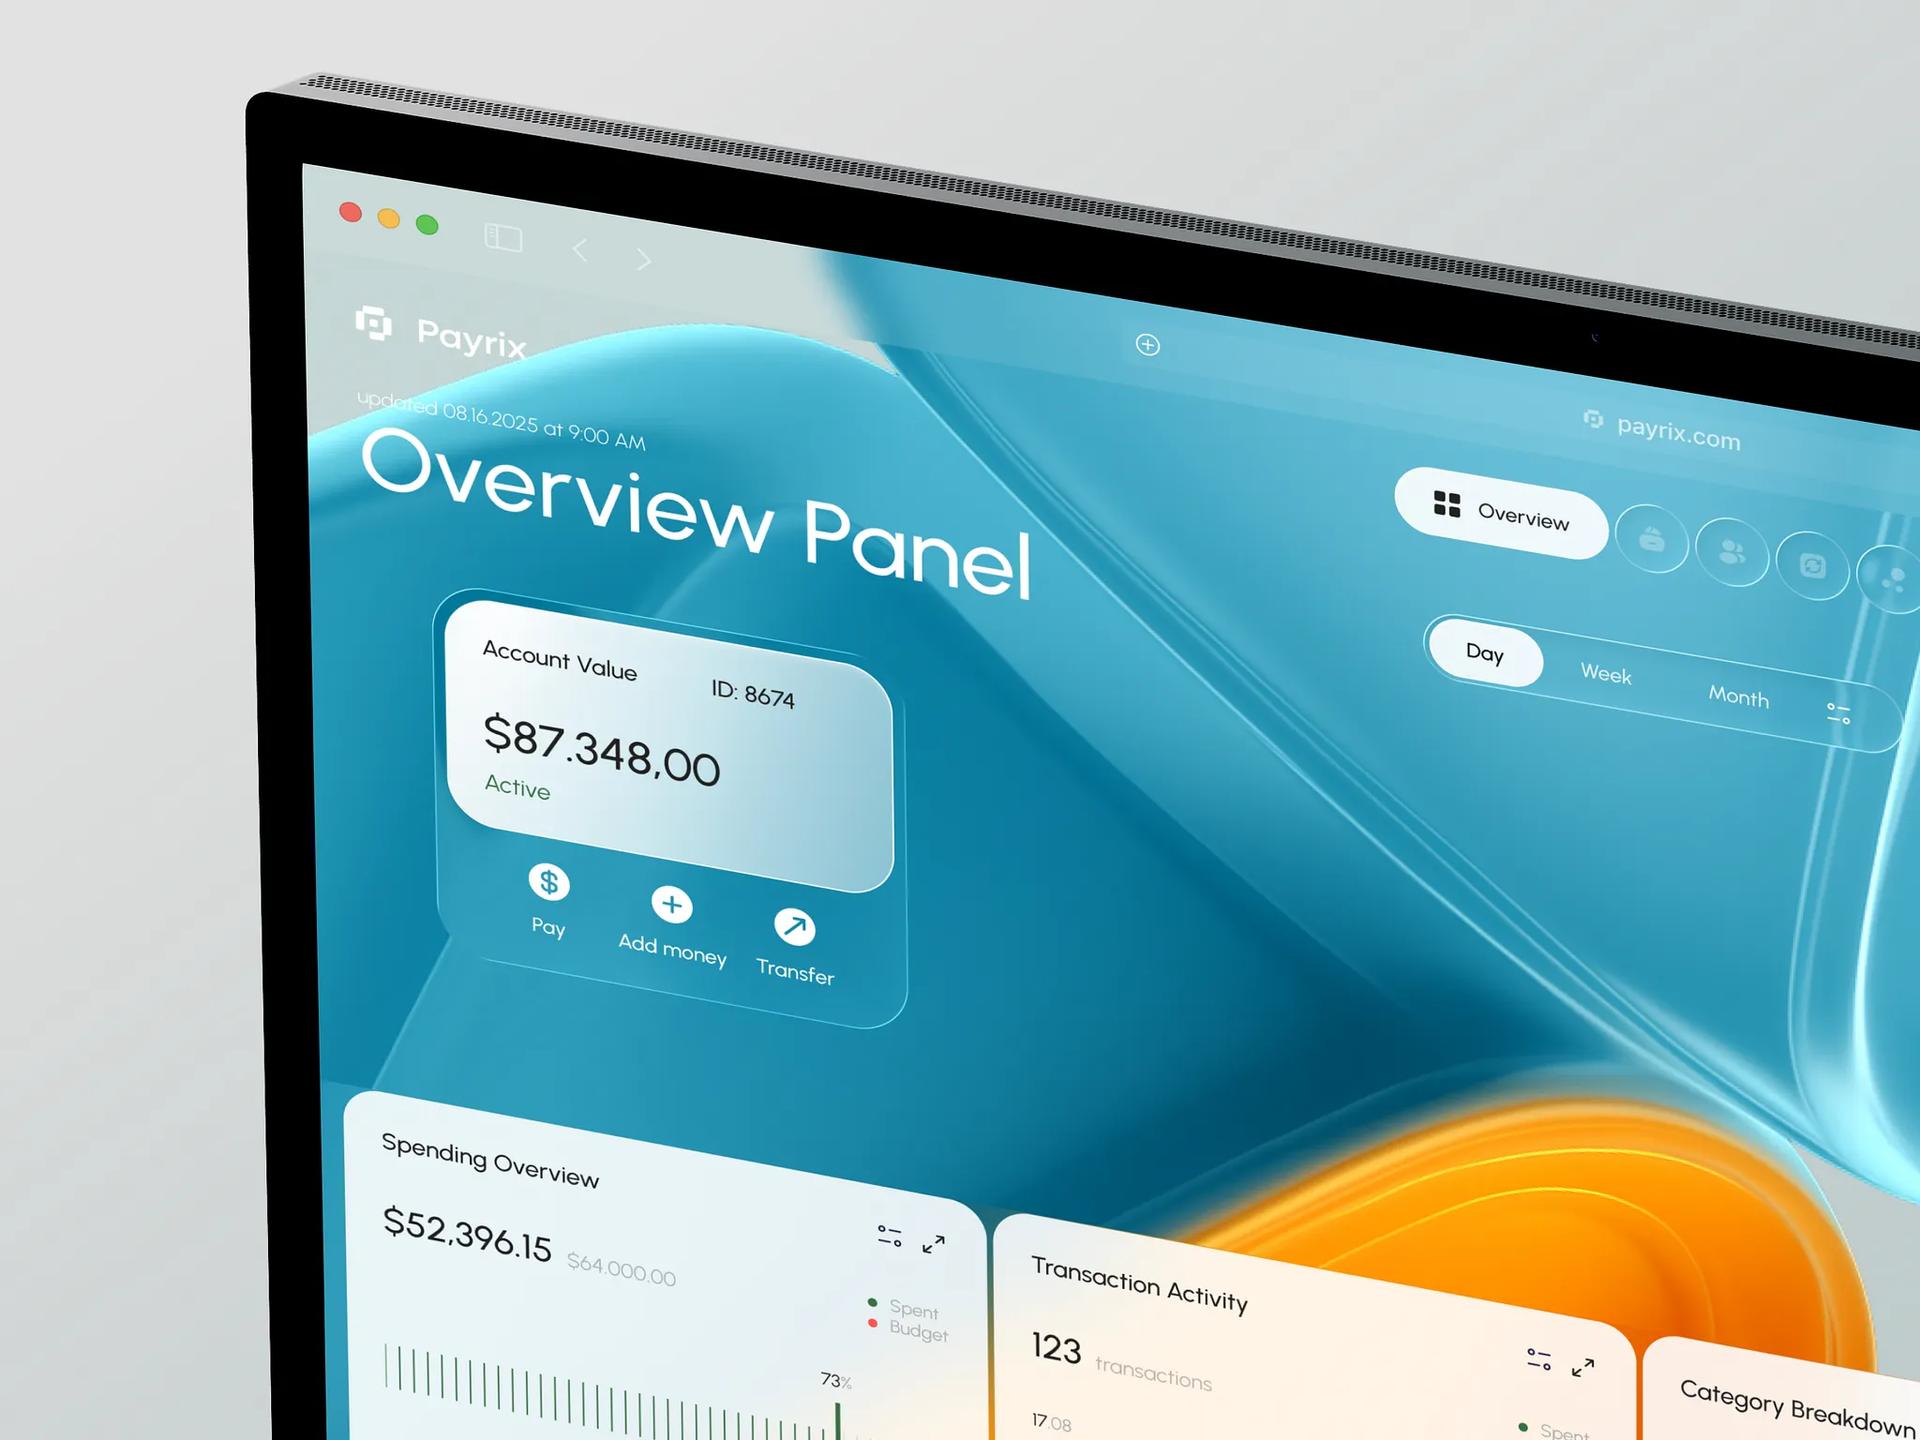
The brief quoted on Payrix SaaS Web Finance Dashboard says users found it "difficult to quickly interpret financial data due to cluttered visuals and rigid layouts." The design answers with a split. The hero has an "Overview Panel" title and a frosted "Account Value" card showing $87.348,00 over teal and orange 3D shapes. Below the fold, the Spending Overview and Transaction Activity cards are close to opaque white, with dark numbers and a bar strip.
Payrix account card by Jack R.
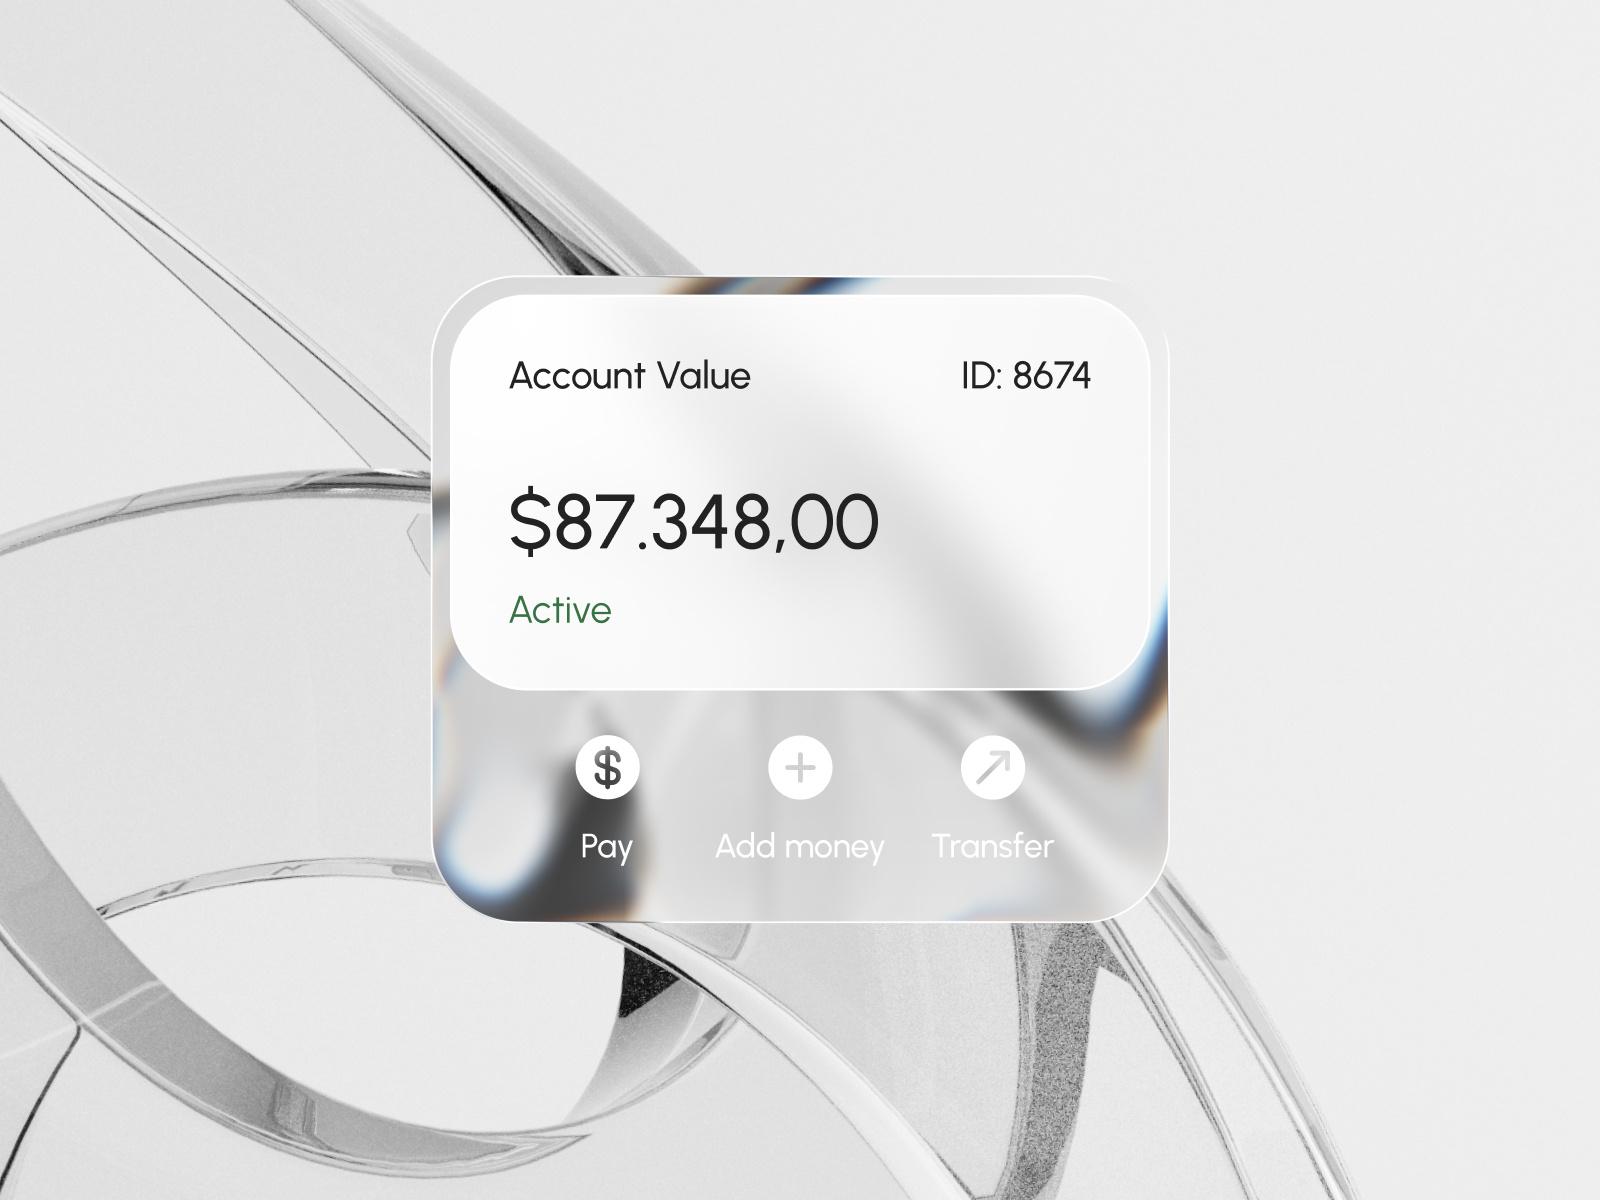
Jack R.'s Payrix card zooms in on that same Account Value component. The balance sits on an inner plate that is nearly solid white, while the row of actions underneath (Pay, Add money, Transfer) sits on clearer glass where chrome rings from the background show through. The designer's stated aim is to "combine clarity with style". In practice, the clarity comes from the solid plate and the style from the clear strip under it.
Payrix mobile by Jack R.
The three phone screens in Payrix SaaS Mobile Finance Dashboard show the pattern at small size. A "Spending Budget" card uses a vertical ruler gauge with a red marker at $12,800, the transactions list sits on a white card with green and red amounts, and the glass is saved for the bottom tab bar and an "Ask anything" pill. Watch the legend under the gauge, though: the values for the categories that aren't selected are set in pale gray on pale glass. That is fine for de-emphasized series, but anything a user needs to read should be darker.

QuickBooks dashboard by Hadi Altaf
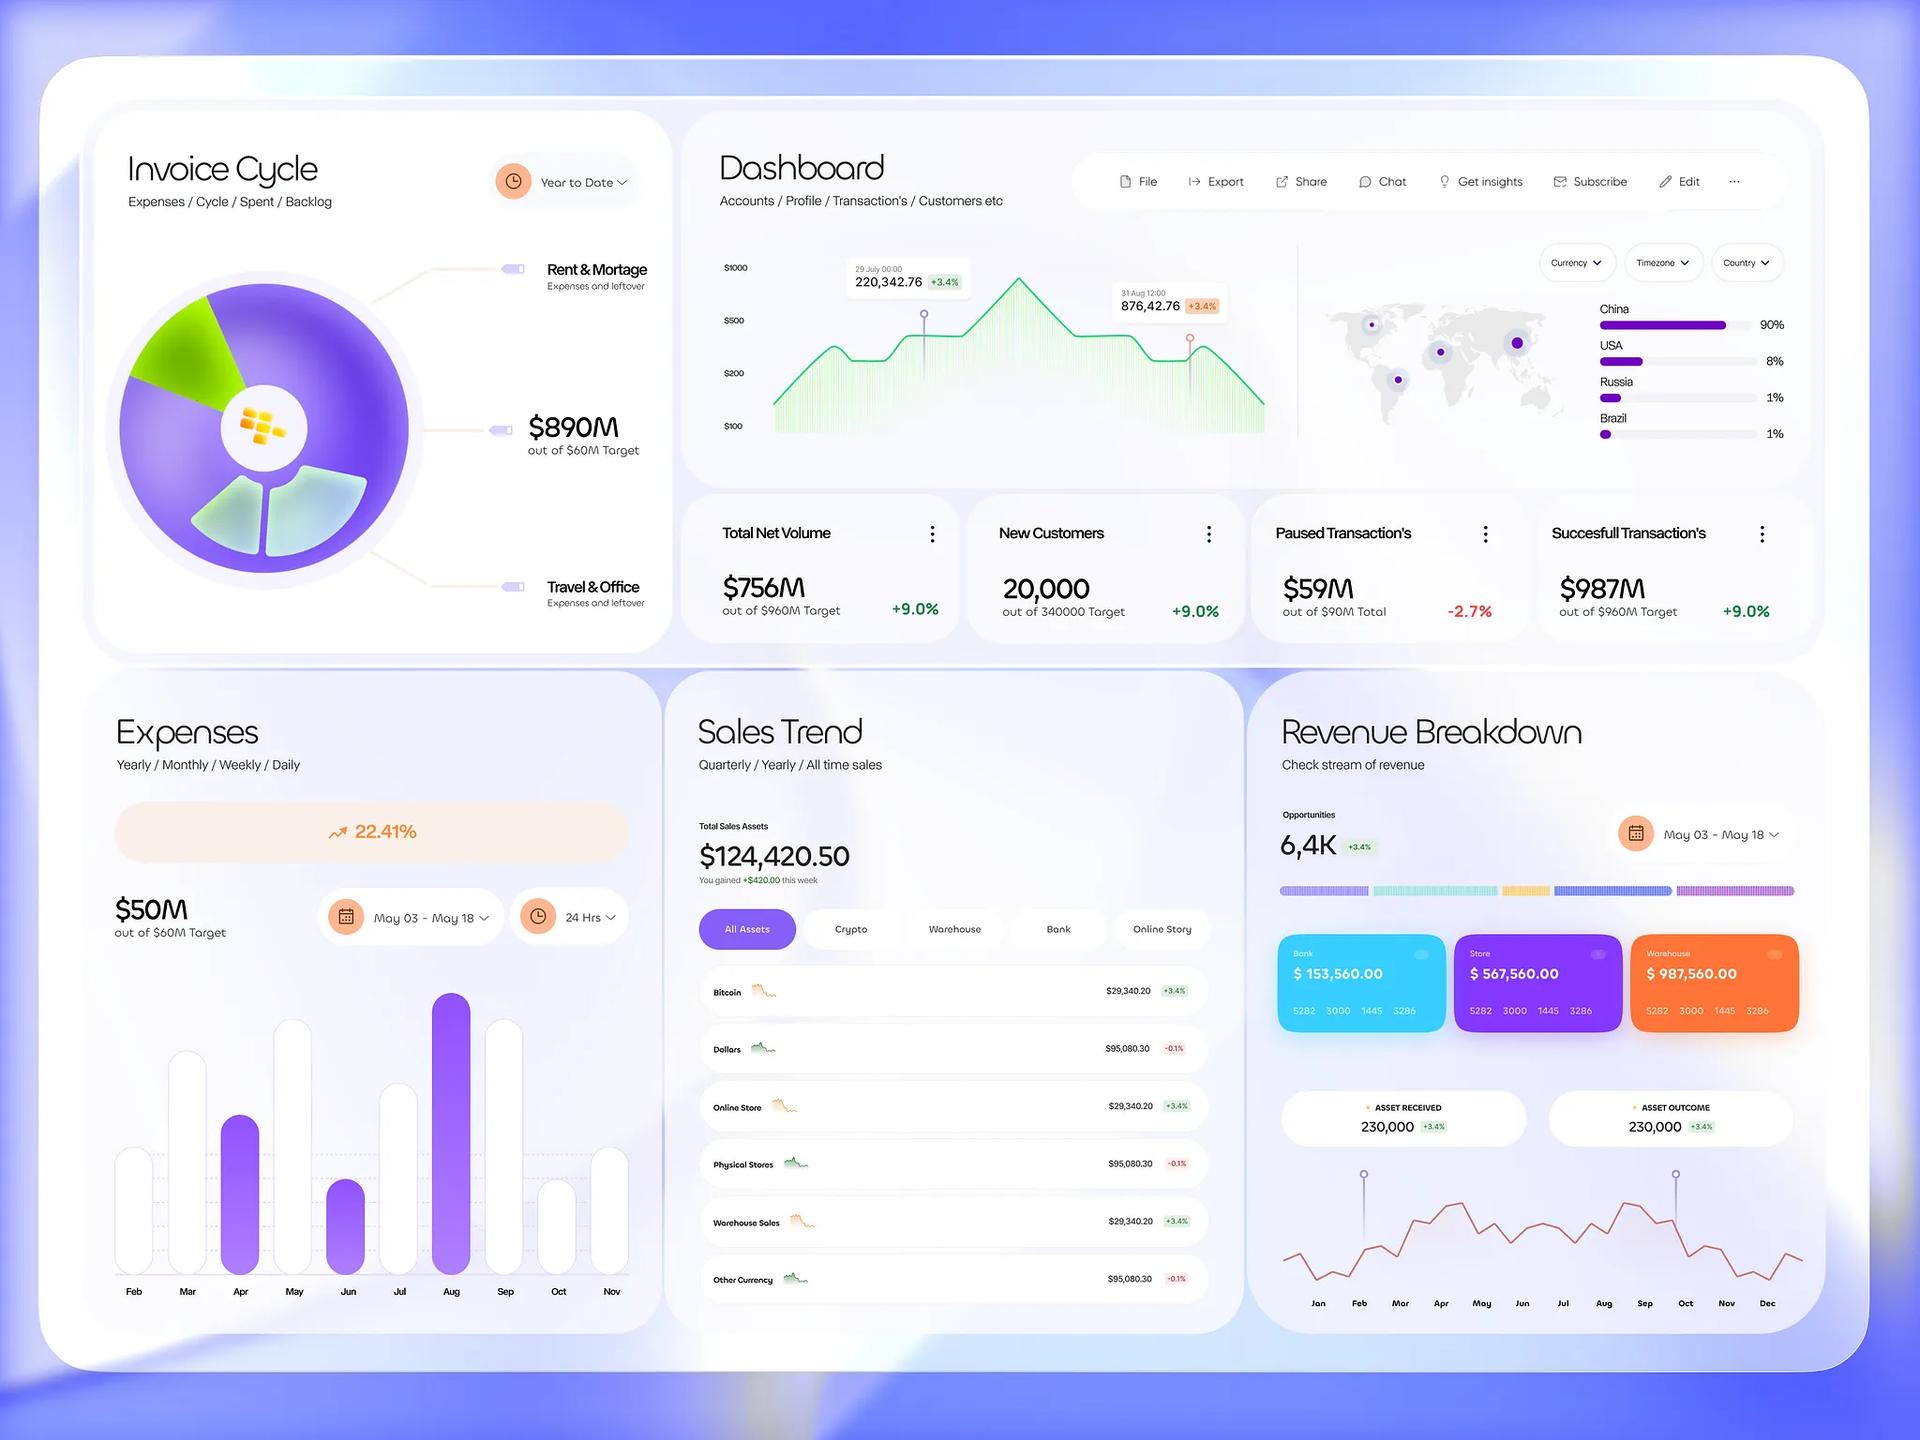
QuickBooks Dashboard Design is a full desktop layout on a violet gradient frame, with panels that are almost solid white. Glass appears in a few deliberate places: one frosted slice of the Invoice Cycle pie chart, and the soft depth of the panels. The Expenses bar chart is the instructive part. Its highlighted months are purple and the rest are white bars on a near-white panel, separated mostly by faint shadow. That reads as "these months matter", but if a user has to compare the white bars, their edges need more contrast against the panel.
Glassmorphism Dashboard by Leon Abramovic
Leon Abramovic writes that in Glassmorphism Dashboard UI Design "the transparent panels, subtle blurs, and soft highlights add depth and elegance while keeping everything functional and easy to read." Every surface is pale blue frosted glass: a double sidebar, KPI cards with green and red sparklines, a table of cases with Low and Medium priority chips, and a country breakdown. It stays readable because the background behind it is a smooth blue gradient with no imagery. The weak spots are the small uppercase gray labels, which are the first thing to fail if the background ever gets busier.

Provit by Dipa Product
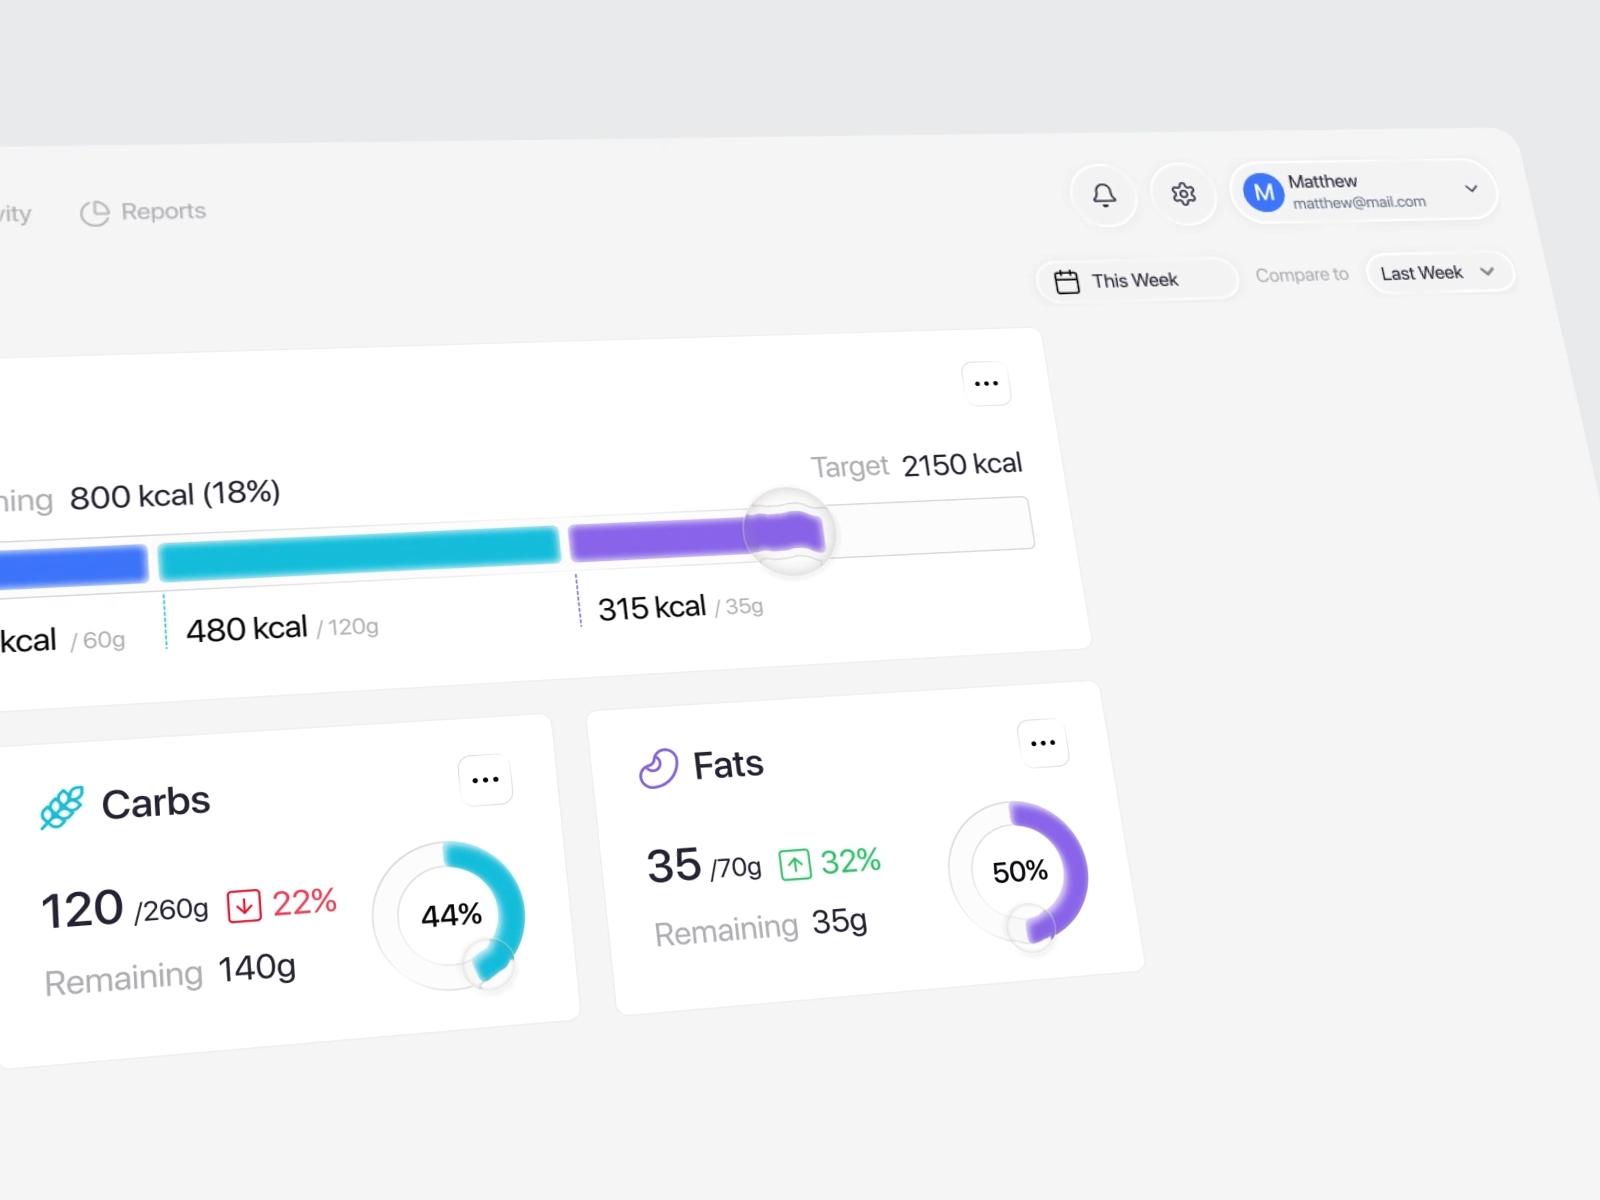
Provit AI Nutrition Tracker Dashboard is described as "a personalized AI nutrition tracker designed with a soft liquid glass interface." The clever part is how little glass it uses. The cards are white and the charts are flat: a stacked calorie bar in blue, cyan and purple against a 2150 kcal target, and donut charts for carbs (44%) and fats (50%). The glass appears as small lens-shaped handles at the end of the progress bar and on the donut rings, magnifying the bar under them. If you want the Liquid Glass feel without risking legibility, this is the pattern to copy.
Energy Analytics by Dtail Studio
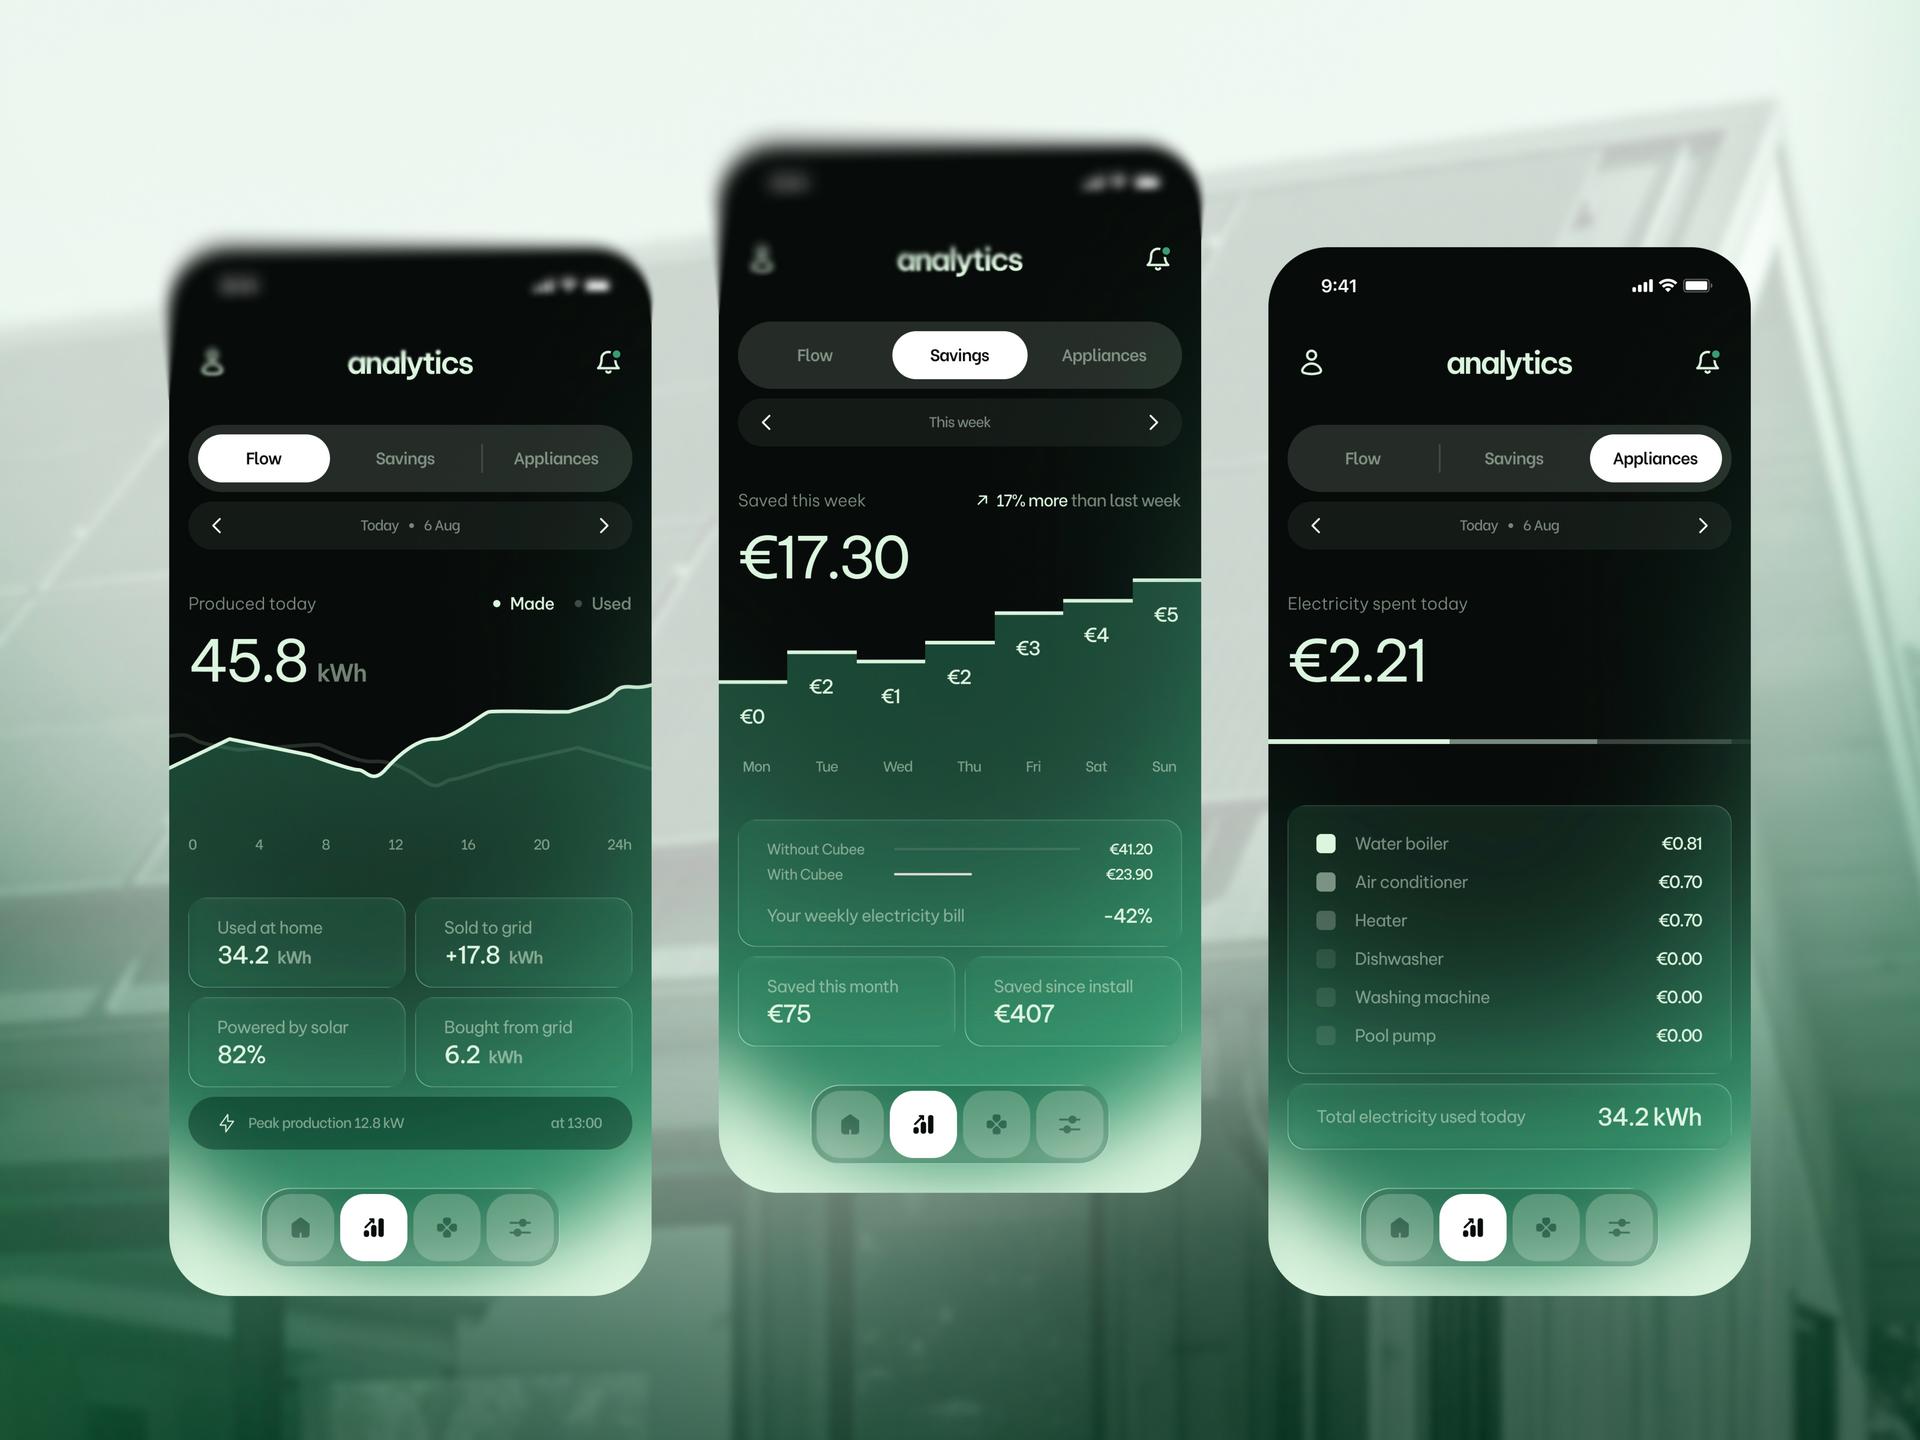
Dtail Studio's Energy Analytics App is for Cubee, which "buys power when the market is cheap and sells the surplus when it peaks." The three dark green screens use tinted glass over a blurred house photo, with very large figures (45.8 kWh, €17.30, €2.21). The Savings chart is a step chart with the euro amount printed on each step, so there is no y-axis or gridline to lose in the blur. Below it, a comparison row reads "Without Cubee €41.20", "With Cubee €23.90" and "-42%", which is the view the designers say "matters". Labeling values directly instead of relying on gridlines is the most transferable idea in this set.
Construction widgets by Rakibul
Liquid Glass Widget Components is a "Smart Construction Dashboard Widget" showing budget used, site power use and material stock. Four glass tiles float over a heavily blurred construction-site photo. The numbers are large and white ("$120.95 Millions", "16.5 KWh", "25 People"), the budget bar chart is in yellow and white, a progress pill reads "60.48% of $200M", and power use is a segmented blue meter. The photo is blurred so far that it acts as a dark color field, which is what lets white text and thin bars work on glass here.

Credit tiles by RonDesignLab
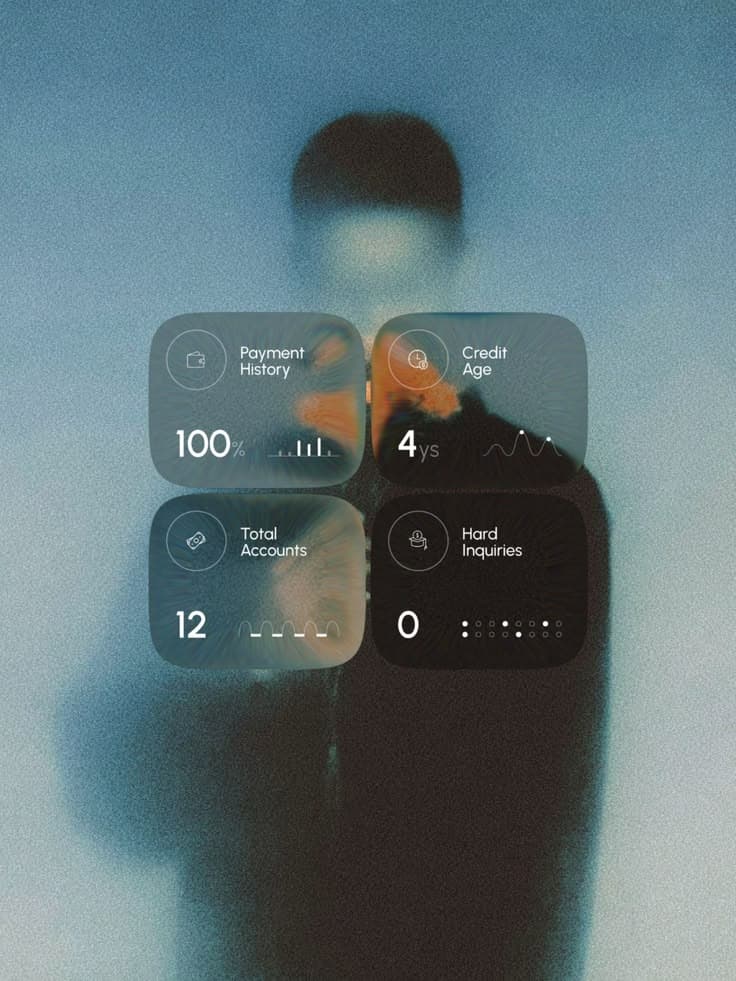
App Store Page UI Design for Fintech App overlays four credit tiles (Payment History, Credit Age, Total Accounts, Hard Inquiries) on a grainy, blurred portrait. RonDesignLab says the layering keeps "every number and label fully legible", and the big numerals (100%, 4ys, 12, 0) do hold up. Look at the tiles side by side, though: the Hard Inquiries tile is much darker than the others because a dark coat sits behind it, so the same glass gives each tile a different contrast. A real dashboard with a scrolling or changing background would have this problem all the time.
Rules for charts and numbers on glass
These follow from the examples above and from WCAG 2.2.
- Measure contrast against the worst part of the background. WCAG asks for 4.5:1 for normal text and 3:1 for large text, and 3:1 for chart elements that are "required to understand the content", measured against adjacent colors.
- Label values directly. Thin gridlines and small axis ticks disappear into blur, so print values on bars, steps or points as Dtail Studio does, or put the plot area on an opaque plate.
- Keep big numbers on glass and small numbers off it. A 48px KPI survives a translucent tile, a 12px axis label usually doesn't.
- Use tabular figures (
font-variant-numeric: tabular-numson the web,.monospacedDigit()in SwiftUI) so columns of numbers line up and don't jitter when values update. - Blur the background until it is a color field. Rakibul's photo works because almost no detail survives behind the tiles; RonDesignLab's coat shows what happens when some does.
- Test the chart palette on the glass itself. A tint shifts every series color under it, and a palette that passes on white may not pass on frosted violet.
- Keep the background still behind live data. Moving wallpapers and video change contrast from second to second.
- Don't stack glass on glass. Apple's session warns against putting glass "within or on top of other glass elements", and in dashboards nested translucent cards quickly turn into mud.
- Give people a solid mode. On Apple platforms, Liquid Glass adjusts automatically when people turn on Reduce Transparency or Increase Contrast; on the web, swap translucent fills for solid ones under
prefers-contrast: more.
Where to keep surfaces opaque
Make these solid or nearly solid every time: tables and dense lists, axis labels and legends, tooltips over charts, form inputs, error and warning states, and anything users compare across rows.
Glass is usually safe for the sidebar and top bar, filter and segmented controls, a tab bar, one hero KPI card, and small floating actions like Payrix's "Ask anything" pill. Provit's lens handles show a third option: keep the data flat and use a tiny piece of glass as the control that moves along it.
Apple's Human Interface Guidelines cover materials and contrast in more depth, and our Liquid Glass explainer covers how glassmorphism differs from Liquid Glass. More dashboards and data screens are in the UI gallery, with style prompts for each on the prompts page.
Sources
- https://developer.apple.com/videos/play/wwdc2025/219/
- https://www.w3.org/WAI/WCAG22/Understanding/contrast-minimum.html
- https://www.w3.org/WAI/WCAG22/Understanding/non-text-contrast.html
- https://developer.mozilla.org/en-US/docs/Web/CSS/font-variant-numeric
- https://developer.apple.com/documentation/swiftui/view/monospaceddigit()
- https://dribbble.com/shots/26550987-Payrix-SaaS-Web-Finance-Dashboard
- https://dribbble.com/shots/27814669-Payrix-SaaS-Web-Finance-Dashboard
- https://dribbble.com/shots/26660890-Payrix-SaaS-Mobile-Finance-Dashboard
- https://dribbble.com/shots/26271985-QuickBooks-Dashboard-Design-Finance-Assets-Bank
- https://dribbble.com/shots/25346029-Glassmorphism-Dashboard-UI-Design
- https://dribbble.com/shots/26280032-Provit-AI-Nutrition-Tracker-Dashboard
- https://dribbble.com/shots/27859561-Energy-Analytics-App-UI-UX-Charts-Mobile-App-Design
- https://dribbble.com/shots/26156081-Liquid-Glass-Widget-Components-Smart-Construction-Dashboard-UI
- https://www.pinterest.com/pin/462604192999408161/